Before you begin reading this guide, we recommend you run Elasticsearch Error Check-Up which analyzes 2 JSON files to detect many errors.
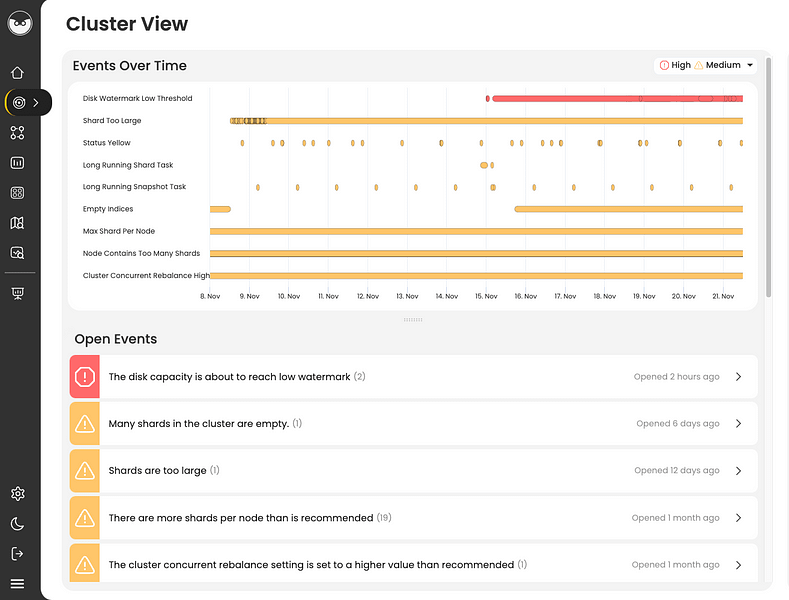
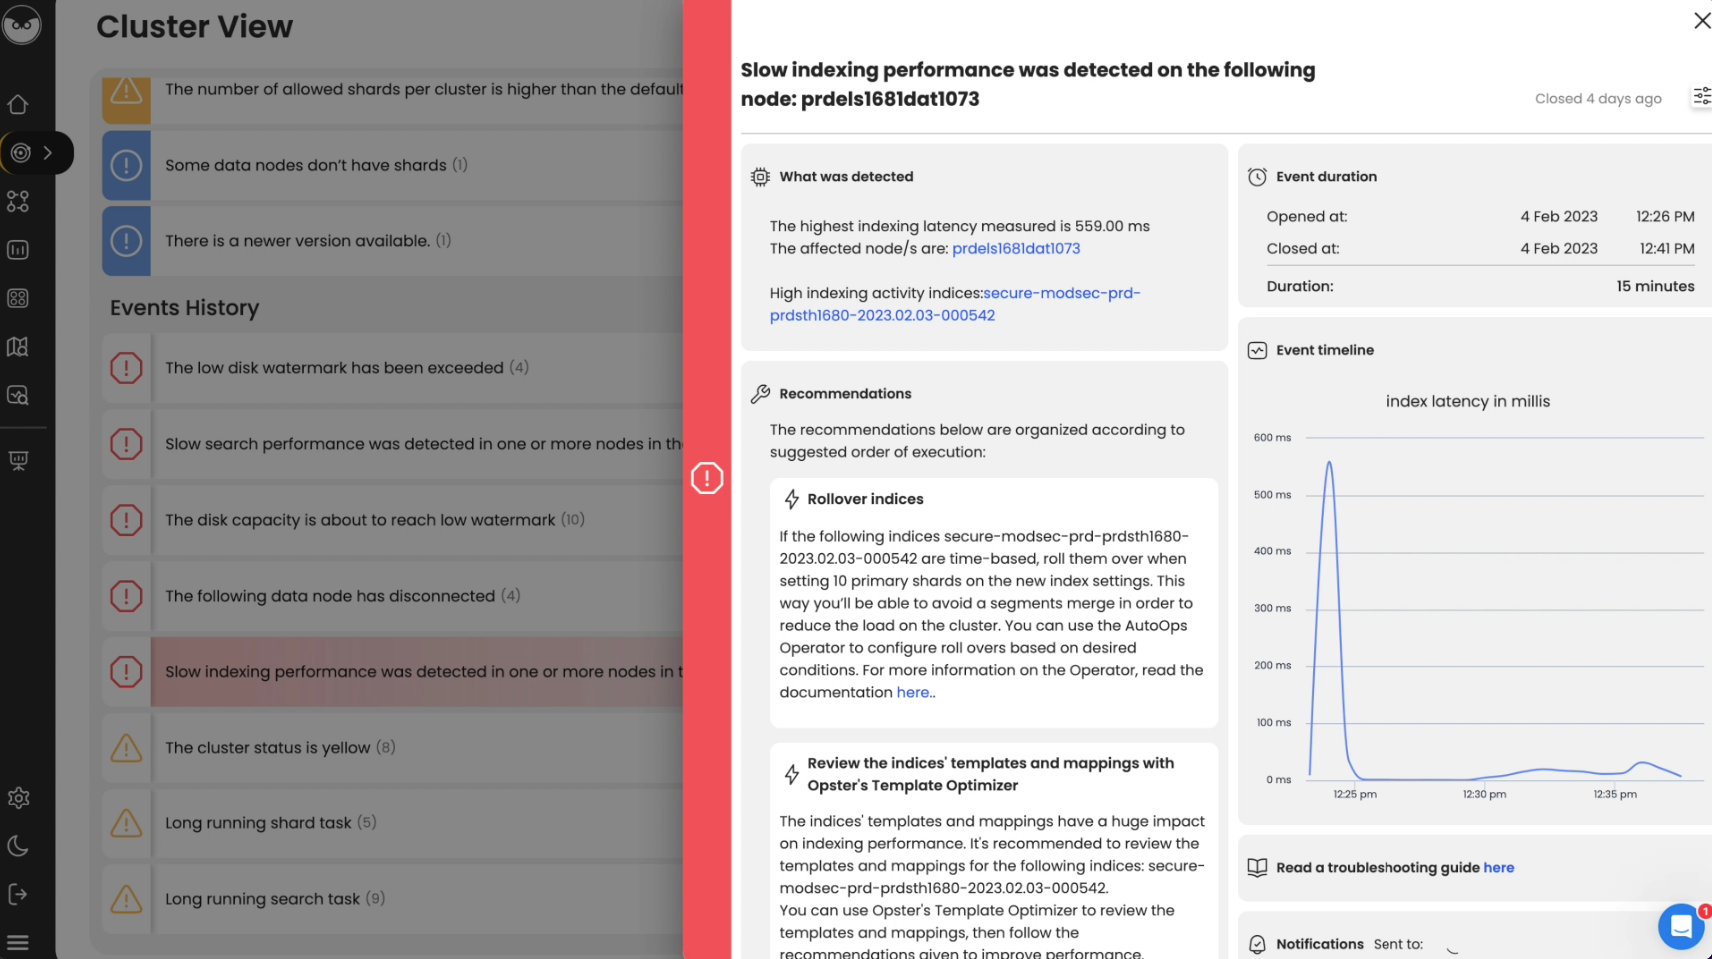
To easily locate the root cause and resolve this issue try AutoOps for Elasticsearch & OpenSearch. It diagnoses problems by analyzing hundreds of metrics collected by a lightweight agent and offers guidance for resolving them. Take a self-guided product tour to see for yourself (no registration required).
This guide will help you check for common problems that cause the log ” Cannot determine current memory usage due to JDK-8207200. ” to appear. To understand the issues related to this log, read the explanation below about the following Elasticsearch concepts: breaker, circuit, indices and memory.
What are circuit breakers?
As explained in Opster’s Elasticsearch Memory Usage Guide, 50% of memory on an Elasticsearch node is generally used for the JVM (Java Virtual Machine) heap, while the other half of the memory is used for other requirements such as cache.
In order to prevent “Out of Memory” (OOM) errors, Elasticsearch implements circuit breakers. If a certain request could cause errors in the node because of memory issues, Elasticsearch will throw a “CircuitBreakerException” and reject the request rather than risk crashing the entire node.
A circuit breaker exception is usually an exception that is thrown to alert us of something else that needs to be fixed to reduce memory usage. Circuit breakers generally come with sensible defaults. Simply increasing the circuit breaking limit is likely to increase the risk that your node crashes due to an OutOfMemoryError.
If you get a circuit breaking exception, you should check what type of circuit breaker it is, and then look at your monitoring data and Elasticsearch logs to diagnose what caused it. Remember that the event or query that appears in the log may just be the “straw that broke the camel’s back”. There may be other causes of high memory usage, and the event in the log is just the very last one which pushed Elasticsearch over the limit. Possible causes are discussed in each section below.
Finding out your current circuit breaker status
Get your current settings
GET /_cluster/settings?include_defaults=true
Find out your current memory usage and breakers
GET _nodes/stats/breaker
This will return useful information like this
"breakers" : {
    	"request" : {
      	"limit_size_in_bytes" : 20574004838,
      	"limit_size" : "19.1gb",
      	"estimated_size_in_bytes" : 0,
      	"estimated_size" : "0b",
      	"overhead" : 1.0,
      	"tripped" : 0
    	},
    	"fielddata" : {
      	"limit_size_in_bytes" : 13716003225,
      	"limit_size" : "12.7gb",
      	"estimated_size_in_bytes" : 0,
      	"estimated_size" : "0b",
      	"overhead" : 1.03,
      	"tripped" : 0
    	},
    	"in_flight_requests" : {
      	"limit_size_in_bytes" : 34290008064,
      	"limit_size" : "31.9gb",
      	"estimated_size_in_bytes" : 6254164,
      	"estimated_size" : "5.9mb",
      	"overhead" : 2.0,
      	"tripped" : 0
    	},
    	"accounting" : {
      	"limit_size_in_bytes" : 34290008064,
      	"limit_size" : "31.9gb",
      	"estimated_size_in_bytes" : 282771278,
      	"estimated_size" : "269.6mb",
      	"overhead" : 1.0,
      	"tripped" : 0
    	},
    	"parent" : {
      	"limit_size_in_bytes" : 32575507660,
      	"limit_size" : "30.3gb",
      	"estimated_size_in_bytes" : 13431618584,
      	"estimated_size" : "12.5gb",
      	"overhead" : 1.0,
      	"tripped" : 0
    	}
  	}
Fielddata circuit breaker
indices.breaker.fielddata.limit (default=40% JVM heap)
indices.breaker.fielddata.overhead (default=1.03)
The limit is set as a proportion of the JVM heap set in jvm.options, while the “overhead” setting is a fixed ratio which Elasticsearch uses to multiply the theoretical calculations to estimate the circuit breaker memory requirement.
Fielddata circuit breaker is a limit on the total amount of memory used by fielddata in your indices. Fielddata is by default set to false on a text field, but may be used where you have defined it in one of your mappings:
"fielddata": true
In general it is recommended to avoid this setting because of the large amount of memory required in putting individual text values into memory. If possible you should change your mappings to set it to false, and use keyword type mappings rather than text type for aggregations and sorting.
However, if this is not possible and you need to aggregate based on individual terms in a text rather than keywords, then you could also consider setting a fielddata frequency filter on the mapping to limit the amount of fielddata put into memory.
PUT my-index-000001
{
  "mappings": {
    "properties": {
      "need_to_aggregate_individual_terms_on_this_field": {
        "type": "text",
        "fielddata": true,
        "fielddata_frequency_filter": {
          "min": 0.001,
          "max": 0.1,
          "min_segment_size": 500
        }
      }
    }
  }
}
Request circuit breaker
indices.breaker.request.limit(default=60% JVM heap)
indices.breaker.request.overhead(default=1)
The limit is set as a proportion of the JVM heap set in jvm.options, while the “overhead” setting is a fixed ratio which Elasticsearch uses to multiply the theoretical calculations to estimate the circuit breaker memory requirement.
The request circuit breaker takes into account the memory required based on the request structures, in particular aggregations. The most common cause of exceeding this circuit breaker is through the use of aggregations with a large size value. Try reducing the value of “size” in your aggregations.
Inflight requests circuit breaker
network.breaker.inflight_requests.limit (default=100% JVM heap)
network.breaker.inflight_requests.overhead (default=2)
The limit is set as a proportion of the JVM heap set in jvm.options, while the “overhead” setting is a fixed ratio which Elasticsearch uses to multiply the theoretical calculations to estimate the circuit breaker memory requirement.
The in-flight requests circuit breaker considers the size of active transport and http requests for the node based on the byte size of those requests. Generally this circuit breaker is activated when batch sizes for bulk requests are too large. Try reducing the size of bulk requests, particularly if those requests contain large documents.
Script compilation circuit breaker
script.context.$CONTEXT.max_compilations_rate (default=75/5m)
The script compilation circuit breaker is slightly different from the others. Rather than applying a memory limit, it limits the number of times a script can be compiled in a given period. If you get this warning, you should use stored scripts with parameters instead of inline ones, as the former are compiled only once, while the latter are compiled on each execution.
Parent circuit breakers
indices.breaker.total.use_real_memory default=true
indices.breaker.total.limit default=95% JVM heap
Parent circuit breaker exceptions are caused by the sum of all memory being used across the different types of circuit breakers. If the use_real_memory is left as the default, then the parent circuit breaker will take into account real memory usage and will be based upon 95% of the JVM heap size. In general it is better to base this circuit upon real memory usage since it gives you a more accurate picture of what is going on in the instance. On the other hand if you choose to set “use_real_memory” to false, then the limit will be based on the sum of the estimates of other circuit breakers in which case the default limit will be reduced to 70% of the JVM heap size to take into account the margin or error with using a sum of estimates.
Accounting circuit breakers
indices.breaker.accounting.limit default= 100% of JVM heap
indices.breaker.accounting.overhead default=1
This circuit breaker is to protect the node from over usage of memory due to things that persist in memory after a request has completed, such as lucene segments before they are flushed to disk. The default limit is however set at 100% of JVM heap so the parent circuit breaker will trip before this limit becomes effective. The accounting overhead setting is a coefficient which is used to multiply all estimates before applying the limit.
Adjusting circuit breakers
In general, and as warned above, it is usually not advisable to modify circuit breakers from their defaults, since it is far worse to lose a node from an OutOfMemoryError than to drop a few requests. Instead you should try to understand why you are exceeding them and prevent this from happening. Also bear in mind that the default calculations are based on your JVM heap size which is generally assumed to be 50% of the total available size. If this is not the case, then you may want to re-consider setting the JVM settings in jvm.options before reconfiguring everything else. However if you still think you need to modify the circuit breakers (or restore the defaults), you can adjust circuit breaker settings just like any other cluster settings
PUT _cluster/settings
{
  "transient": {"indices.breaker.total.limit":"5GB" }
}
Or to restore the setting to it’s default
PUT _cluster/settings
{
  "transient": {"indices.breaker.total.limit":null }
}
How to avoid circuit breaker exceptions
Overview
In Elasticsearch, an index (plural: indices) contains a schema and can have one or more shards and replicas. An Elasticsearch index is divided into shards and each shard is an instance of a Lucene index.
Indices are used to store the documents in dedicated data structures corresponding to the data type of fields. For example, text fields are stored inside an inverted index whereas numeric and geo fields are stored inside BKD trees.
Examples
Create index
The following example is based on Elasticsearch version 5.x onwards. An index with two shards, each having one replica will be created with the name test_index1
PUT /test_index1?pretty
{
    "settings" : {
        "number_of_shards" : 2,
        "number_of_replicas" : 1
    },
    "mappings" : {
        "properties" : {
            "tags" : { "type" : "keyword" },
            "updated_at" : { "type" : "date" }
        }
    }
}
List indices
All the index names and their basic information can be retrieved using the following command:
GET _cat/indices?v
Index a document
Let’s add a document in the index with the command below:
PUT test_index1/_doc/1
{
  "tags": [
    "opster",
    "elasticsearch"
  ],
  "date": "01-01-2020"
}
Query an index
GET test_index1/_search
{
  "query": {
    "match_all": {}
  }
}
Query multiple indices
It is possible to search multiple indices with a single request. If it is a raw HTTP request, index names should be sent in comma-separated format, as shown in the example below, and in the case of a query via a programming language client such as python or Java, index names are to be sent in a list format.
GET test_index1,test_index2/_search
Delete indices
DELETE test_index1
Common problems
- It is good practice to define the settings and mapping of an Index wherever possible because if this is not done, Elasticsearch tries to automatically guess the data type of fields at the time of indexing. This automatic process may have disadvantages, such as mapping conflicts, duplicate data and incorrect data types being set in the index. If the fields are not known in advance, it’s better to use dynamic index templates.
- Elasticsearch supports wildcard patterns in Index names, which sometimes aids with querying multiple indices, but can also be very destructive too. For example, It is possible to delete all the indices in a single command using the following commands:
DELETE /*
To disable this, you can add the following lines in the elasticsearch.yml:
action.destructive_requires_name: true
Log Context
Log “Cannot determine current memory usage due to JDK-8207200.” classname is HierarchyCircuitBreakerService.java.
We extracted the following from Elasticsearch source code for those seeking an in-depth context :
         } catch (IllegalArgumentException ex) {
            // This exception can happen (rarely) due to a race condition in the JVM when determining usage of memory pools. We do not want
            // to fail requests because of this and thus return zero memory usage in this case. While we could also return the most
            // recently determined memory usage; we would overestimate memory usage immediately after a garbage collection event.
            assert ex.getMessage().matches("committed = \d+ should be
Find & fix Elasticsearch problems