When viewing Elasticsearch searches, it’s very difficult to derive actionable insights without knowing which of your users searched for what.
Assigning which searches belong to which users is a crucial step towards improving search performance in Elasticsearch. This is especially important in cases of search latency and heavy searches, or whenever an issue has occurred that needs to be addressed from the correct source.
In order to group search usage by user and application on your own, you need to add an applicable header. If you initiate a call with an X-Opaque-ID header, then the user ID will be included as an additional ID field. Then, you can collect and parse the slow logs according to the header and retrieve the information you want.
This process is both time consuming and complicated, and is only a viable option from Elasticsearch version 7.4 and onwards as the function of applicable headers is not available on earlier versions.
With Opster’s Search Gateway you can easily see which of your users generated heavy searches and what the specifications of each search are.
The Gateway automatically retrieves all of your search logs, extracts and assigns the executing user, breaks them down into fields and displays them on Kibana dashboards for easy viewing. The logs retrieved describe search times from end-to-end, meaning the complete amount of time that elapsed from when the search request was entered until the results were displayed.
The Search Gateway allows you to automatically group search usage by users and applications. It accepts applicable headers with the user identifiers that are sent from the applications, and knows how to read them and associate each search with its user. This way queries can be assigned to their user and you can see usage patterns grouped by user.

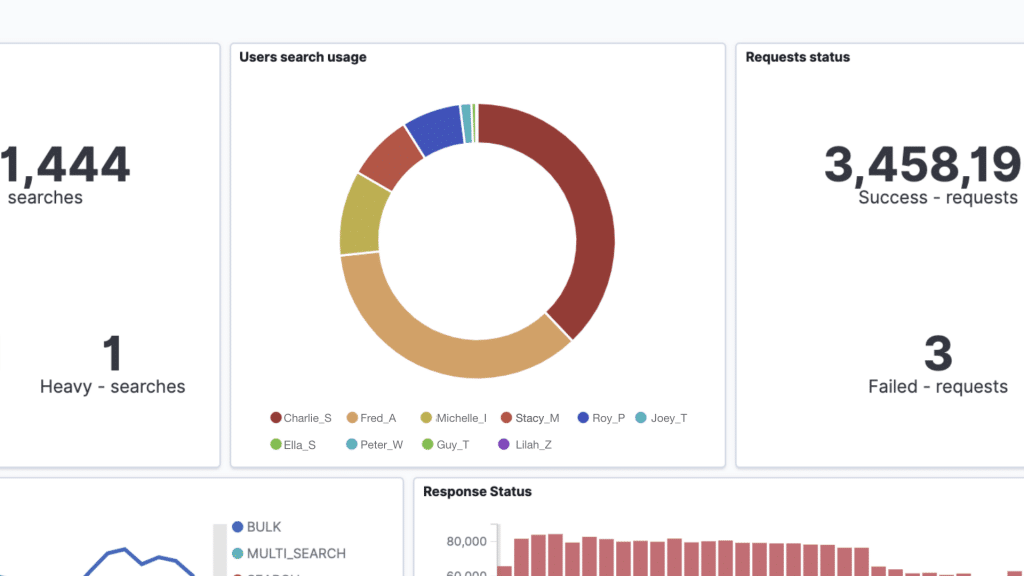
This grouping will help you analyze your searches because you’ll be able to know which users generated which searches and the specifications of each search, meaning you’ll be able to locate slow searches and identify the user/application running them.
With that ability, you will be able to educate users on how to run performant searches, prevent heavy searches and block users as needed in order to keep the cluster up and available.
To book a demo of the Search Gateway, click here.
To begin optimizing your searches and improving your performance, you can use Opster’s free Search Log Analyzer. With Opster’s Analyzer, you can easily locate slow searches and understand what led to them adding additional load to your system. You’ll receive customized recommendations for how to reduce search latency and improve your search performance. The tool is free and takes just 2 minutes to run.